
Why Maturity Models Matter for Zero Trust
Zero trust is not a product you buy and install. It is a strategy that evolves over months and years across every layer of your infrastructure. The problem most organizations face is not whether to adopt zero trust — 76 percent already say they are — but how to measure whether their implementation actually works.
That is where maturity models come in. A zero trust maturity model gives you a structured way to assess where you are today, identify the biggest gaps, and build a roadmap that prioritizes the changes that reduce the most risk. Without one, zero trust adoption tends to stall after the easy wins (like MFA rollout) because teams lose visibility into what comes next.
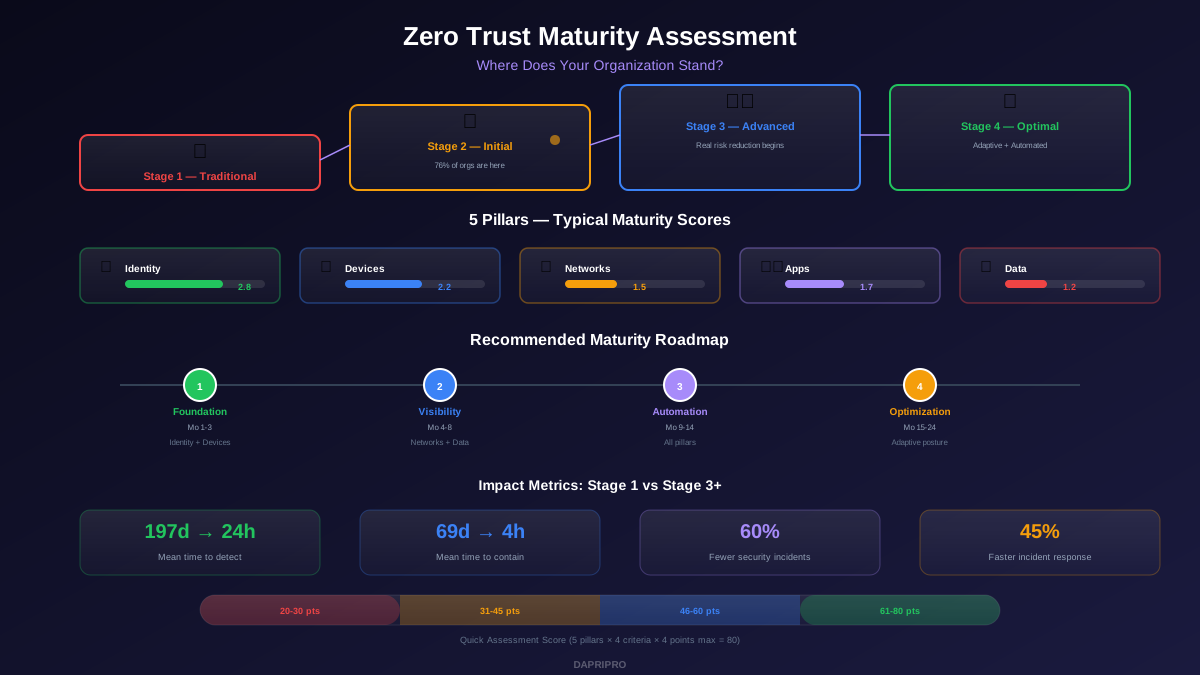
The most widely adopted framework is the CISA Zero Trust Maturity Model, which the U.S. Cybersecurity and Infrastructure Security Agency updated in 2024. It defines 5 pillars and 4 maturity stages, giving organizations a clear scoring system regardless of industry or size.
The CISA Zero Trust Maturity Model Explained
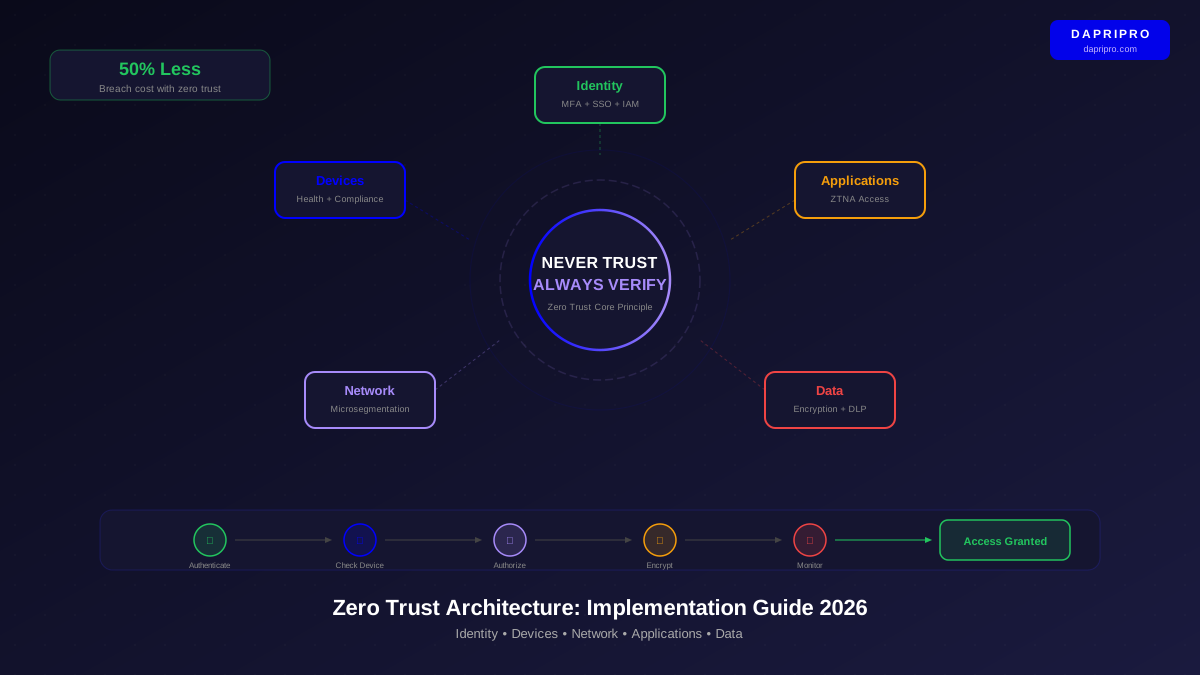
CISA's model evaluates zero trust readiness across 5 pillars. Each pillar progresses independently through 4 stages, so you might be advanced in identity but still traditional in network segmentation. Understanding each pillar helps you focus effort where it matters most.
The 5 Pillars
| Pillar | What It Covers | Key Technologies | Avg. Time to Stage 3 |
|---|---|---|---|
| Identity | User authentication, authorization, MFA, SSO, identity governance | Okta, Entra ID, Duo | 3-6 months |
| Devices | Device inventory, posture checks, compliance enforcement, EDR | CrowdStrike, Intune, Jamf | 6-12 months |
| Networks | Microsegmentation, encrypted traffic, software-defined perimeters | Zscaler, Illumio, Cloudflare | 12-18 months |
| Applications & Workloads | App access controls, container security, CI/CD pipeline protection | Prisma Cloud, Aqua, Wiz | 12-18 months |
| Data | Classification, encryption, DLP, access logging, rights management | Microsoft Purview, Varonis | 18+ months |
The 4 Maturity Stages
Each pillar moves through these stages independently:
- Stage 1 — Traditional: Manual processes, perimeter-based security, limited visibility. No zero trust principles applied. Most legacy environments start here.
- Stage 2 — Initial: Some automation exists. MFA deployed for some users, basic device management in place, but policies are still broad and enforcement is inconsistent.
- Stage 3 — Advanced: Policies are context-aware and automated. Continuous verification happens across most systems. Microsegmentation covers critical workloads. This is where real risk reduction begins.
- Stage 4 — Optimal: Fully automated, adaptive security across all pillars. Real-time risk scoring drives dynamic access decisions. Very few organizations reach this stage in every pillar.
Self-Assessment: Scoring Your Organization
Before you can build a roadmap, you need an honest baseline. Use this quick scoring guide for each of the 5 pillars. Rate each pillar from 1 to 4 based on where your organization currently stands.
Identity Pillar Assessment
| Criteria | Stage 1 (1 pt) | Stage 2 (2 pts) | Stage 3 (3 pts) | Stage 4 (4 pts) |
|---|---|---|---|---|
| MFA coverage | None or partial | All external access | All users + privileged | Phishing-resistant everywhere |
| SSO adoption | No SSO | Some apps via SAML | 80%+ apps integrated | Universal SSO + passwordless |
| Identity governance | Manual provisioning | Basic lifecycle mgmt | Automated JML flows | Continuous access reviews |
| Privileged access | Shared admin accounts | PAM for some admins | Just-in-time access | Zero standing privileges |
Device Pillar Assessment
| Criteria | Stage 1 (1 pt) | Stage 2 (2 pts) | Stage 3 (3 pts) | Stage 4 (4 pts) |
|---|---|---|---|---|
| Inventory | Unknown devices on network | Spreadsheet tracking | Automated discovery | Real-time CMDB |
| Posture checks | None | Basic antivirus check | Compliance scoring | Continuous posture assessment |
| Endpoint protection | Legacy AV only | Next-gen AV | EDR deployed | XDR with auto-response |
| BYOD policy | No policy | Allow with VPN | MAM/containerization | Risk-tiered access levels |
Quick Score Interpretation
Add up your scores across all 5 pillars (20 criteria total, max score of 80):
- 20-30 points — Traditional: Major gaps across most pillars. Start with identity (MFA + SSO) and device inventory as quick wins.
- 31-45 points — Initial: Foundations exist but enforcement is inconsistent. Focus on automating what you already have and closing gap pillars.
- 46-60 points — Advanced: Strong posture in most areas. Address remaining legacy systems and build toward continuous verification.
- 61-80 points — Optimal: Leading maturity. Focus on advanced automation, threat-informed policies, and real-time risk scoring.
Pillar-by-Pillar Gap Analysis
The biggest mistake organizations make is trying to advance all pillars simultaneously. Instead, identify your weakest pillar and focus there first. Here is what the typical gap pattern looks like:
Common Gaps by Pillar
Identity gaps (easiest to close): The most frequent issue is partial MFA deployment — organizations enable it for cloud apps but skip legacy systems, VPNs, and admin consoles. Fixing this alone moves your identity score from 1.5 to 2.5. Another gap is lack of automated deprovisioning. Former employees retaining access for days or weeks after leaving is a Stage 1 indicator.
Device gaps: Most organizations have some form of endpoint protection but lack posture-based access control. Your EDR might detect threats, but does it block a non-compliant device from accessing sensitive data? If the answer is no, you are still at Stage 1 or 2 for device trust. BYOD is another weak spot — organizations either block personal devices entirely (hurting productivity) or allow them without controls (hurting security).
Network gaps (hardest to close for legacy orgs): Flat networks remain the biggest blocker for zero trust maturity. If a compromised workstation can reach your database servers directly, no amount of identity security compensates. Microsegmentation requires traffic mapping first, which takes 4 to 8 weeks. Organizations skip this step and fail deployment because they break legitimate connections.
Data gaps (most overlooked): Data classification is where most organizations fall short. You cannot protect what you have not labeled. Without classification, DLP rules either trigger too many false positives (and get ignored) or miss sensitive data entirely. Start with automated discovery tools that scan file shares, databases, and cloud storage for PII, financial data, and intellectual property.
Building Your Maturity Roadmap
A realistic roadmap does not try to reach optimal maturity in every pillar within a year. Instead, it sequences improvements based on risk reduction per dollar spent and implementation complexity.
Recommended Sequencing
| Phase | Timeline | Focus Pillars | Key Actions | Expected Impact |
|---|---|---|---|---|
| Phase 1: Foundation | Months 1-3 | Identity + Devices | Deploy phishing-resistant MFA everywhere, enforce SSO, automate user lifecycle, deploy EDR on all endpoints | 40% reduction in credential-based attacks |
| Phase 2: Visibility | Months 4-8 | Networks + Data | Map traffic flows, begin microsegmentation of critical workloads, deploy automated data classification | 60% reduction in lateral movement paths |
| Phase 3: Automation | Months 9-14 | All pillars | Context-aware access policies, automated device compliance enforcement, DLP with classification-driven rules | Continuous verification across 80%+ of environment |
| Phase 4: Optimization | Months 15-24 | All pillars | Real-time risk scoring, dynamic policy adjustment, zero standing privileges for all admins | Near-optimal maturity with adaptive security posture |
Budget Considerations by Maturity Stage
Moving from Stage 1 to Stage 2 is often the cheapest transition because many tools are already available — you just need to configure them properly. Most cloud platforms include basic conditional access, MFA, and device management at no extra cost. The jump from Stage 2 to Stage 3 is where significant investment typically occurs, requiring dedicated microsegmentation tools, PAM solutions, and data classification platforms.
A mid-size organization (500-2000 employees) should budget approximately:
- Stage 1 to Stage 2: $5K-$25K — mostly configuration and policy work, minimal new tooling
- Stage 2 to Stage 3: $50K-$200K — microsegmentation, PAM, advanced EDR/XDR, data classification
- Stage 3 to Stage 4: $150K-$500K — SOAR integration, real-time risk engines, zero standing privileges across all systems
Measuring Progress: Metrics That Matter
Maturity scores alone do not tell the full story. Track these operational metrics alongside your pillar scores to validate that higher maturity actually reduces risk:
| Metric | Stage 1 Baseline | Stage 3 Target | Why It Matters |
|---|---|---|---|
| Mean time to detect (MTTD) | 197 days | <24 hours | Continuous monitoring replaces periodic reviews |
| Mean time to contain (MTTC) | 69 days | <4 hours | Microsegmentation limits blast radius automatically |
| Credential-based incidents | 12+/year | <2/year | Phishing-resistant MFA eliminates most credential theft |
| Lateral movement attempts | Undetected | 100% logged + 90% blocked | Segmentation makes lateral movement visible |
| Policy exceptions | Unmeasured | <5% of access requests | Exceptions signal gaps in zero trust coverage |
| Access review completion | <50% | 100% quarterly | Automated reviews catch privilege creep |
Quarterly Review Cadence
Schedule a quarterly maturity review that includes three components. First, rescore each pillar using the same assessment criteria you used initially — consistency matters more than precision. Second, compare operational metrics against your previous quarter to verify that maturity improvements translate to real risk reduction. Third, update your roadmap based on any new threats, budget changes, or organizational shifts that occurred during the quarter.
Organizations that follow this cadence consistently advance 0.5 to 1.0 maturity stages per pillar per year. Organizations that assess only annually tend to plateau because they lose momentum between reviews.
Common Mistakes That Stall Zero Trust Maturity
After analyzing hundreds of zero trust implementations, these five mistakes cause the most delays:
Mistake 1 — Treating zero trust as a technology project. Organizations buy ZTNA tools and microsegmentation platforms without changing access policies, identity workflows, or incident response processes. Technology without policy change produces Stage 2 maturity at best, regardless of tool sophistication.
Mistake 2 — Ignoring legacy systems. That on-premises ERP running Windows Server 2016 with no MFA support does not disappear from your risk profile just because your cloud apps have conditional access. Legacy systems need compensating controls — network isolation, jump servers, and enhanced logging — until they can be migrated or replaced.
Mistake 3 — Skipping the discovery phase. Every failed microsegmentation project we have seen skipped traffic mapping. You cannot write allow-list policies without knowing what legitimate traffic looks like. Budget 4 to 8 weeks for discovery before attempting enforcement.
Mistake 4 — Over-restricting too fast. Moving from permissive policies to strict enforcement overnight breaks workflows and erodes employee trust in the security team. Use monitor-only mode for at least 30 days before enforcing new segmentation policies or conditional access rules.
Mistake 5 — No executive sponsorship. Zero trust maturity requires cross-functional cooperation between identity, network, endpoint, and data teams. Without a CISO or VP-level sponsor who can resolve turf wars and prioritize funding, initiatives stall after the first pillar.
Tools for Automated Maturity Assessment
Manual assessments work for initial baselines, but automated tools provide continuous visibility and reduce the effort needed for quarterly reviews.
| Tool | Type | What It Measures | Best For |
|---|---|---|---|
| Microsoft Secure Score | Free (M365) | Identity, device, data across Microsoft stack | Organizations on Microsoft 365 E3/E5 |
| CISA ZT Assessment | Free | All 5 pillars via questionnaire | Initial baseline for any organization |
| Zscaler ZT Dashboard | Included w/ Zscaler | Network segmentation, app access, user risk | Zscaler customers tracking network pillar |
| CrowdStrike Zero Trust Assessment | Included w/ Falcon | Device posture, identity risk, lateral movement | CrowdStrike customers tracking device pillar |
| Panaseer | Paid | Continuous controls monitoring across all pillars | Enterprise orgs wanting vendor-agnostic dashboard |
The best approach combines a free framework-based assessment (like CISA's questionnaire) for strategic planning with vendor-specific dashboards (like Secure Score or CrowdStrike ZTA) for operational tracking. This gives you both the big picture and the granular metrics you need to drive daily improvement.
What Advanced Maturity Actually Looks Like
Organizations at Stage 3 or higher share several observable characteristics that distinguish them from lower-maturity peers. Their access decisions happen dynamically — a user logging in from a new device in an unusual location at 3 AM triggers step-up authentication automatically, not because someone wrote a manual exception. Device compliance is checked before every session, not just at enrollment. Network segmentation policies update when new workloads are deployed, without requiring a firewall change request.
Most importantly, advanced-maturity organizations measure security outcomes, not just controls deployed. They track mean time to detect, contain, and recover. They know exactly how many policy exceptions exist and why each one was approved. They can answer the question "if an attacker compromised endpoint X, what could they reach?" in minutes, not weeks.
That level of visibility is not about buying more tools. It is about connecting the tools you already have, automating the policies you already wrote, and measuring the outcomes that actually indicate risk reduction. That is what zero trust maturity means in practice — not a score on a spreadsheet, but a demonstrable reduction in what an attacker can achieve if they get past your first line of defense.