
Your CISO asks: "Is our security awareness program working?" You pull up the dashboard: 94% completion rate, average quiz score 87%, 1,200 training hours logged. You present these numbers with confidence.
But here is the problem — none of those numbers answer the question. They tell you employees consumed training, not that they changed behavior. Your phishing click rate could be 30% and rising while your completion rate sits at 94%.
Real measurement requires tracking what people do, not what they watch. This article covers the 8 metrics that actually prove your program works, how to calculate ROI in dollars, and how to present results to executives who control your budget.
Vanity Metrics vs Real Metrics
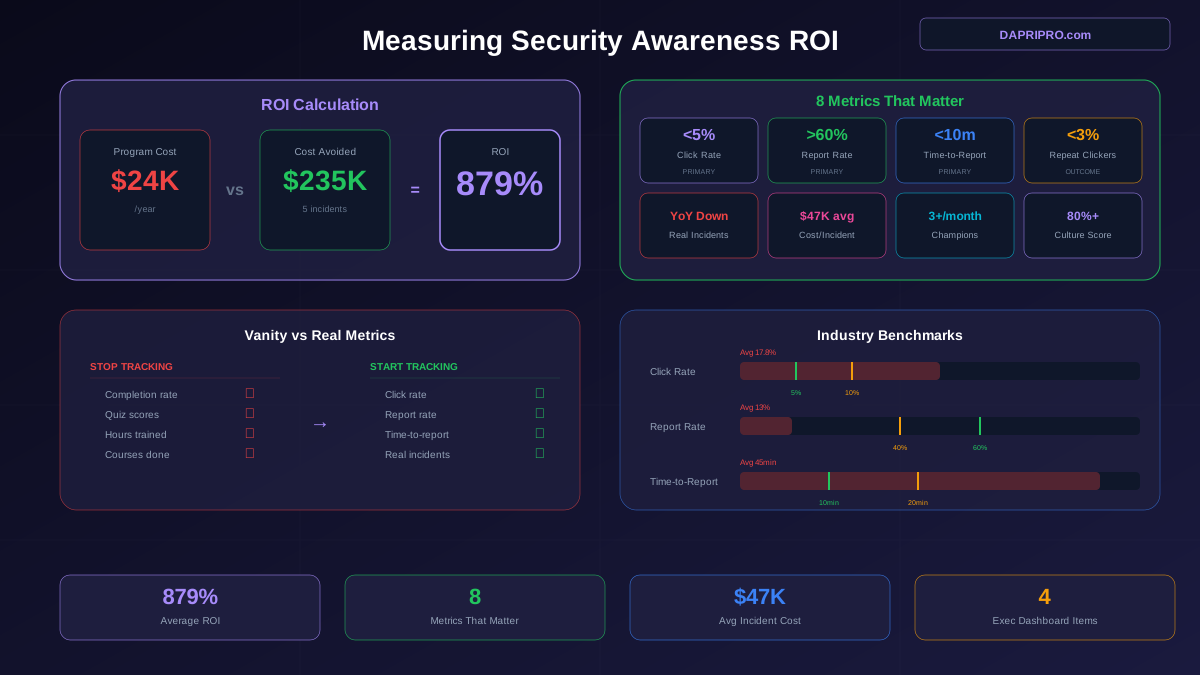
First, let us separate the metrics that look good in a report from the metrics that tell you whether your program is working:
| Vanity Metric | Why It Fails | Replace With |
|---|---|---|
| Completion rate (94%) | Measures clicking "Next" | Phishing click rate |
| Quiz score (87%) | Tests memorization, not action | Simulation report rate |
| Hours trained (1,200) | More hours ≠ better outcomes | Time-to-report |
| Courses done (12) | Quantity over quality | Real incident count |
The 8 Metrics That Matter
1. Phishing Click Rate
What it measures: Percentage of employees who click links in simulated phishing emails.
Why it matters: This is the most direct measure of phishing vulnerability. A declining trend means employees are developing the instinct to pause before clicking.
Target: Below 10% within 6 months, below 5% within 12 months.
How to track: Monthly simulations with varying difficulty. Average the rate over 3-month rolling periods to smooth out noise from individual campaigns.
2. Report Rate
What it measures: Percentage of employees who use the phish report button on simulated emails.
Why it matters: More important than click rate. An employee who clicks but reports within 5 minutes enables fast containment. One who deletes silently leaves the SOC blind.
Target: Above 60% within 12 months. World-class programs reach 70-80%.
3. Time-to-Report
What it measures: Median time between a simulated phishing email landing in the inbox and being reported.
Why it matters: In a real attack, speed of detection determines the blast radius. Every minute counts during a credential compromise.
Target: Median under 10 minutes.
4. Repeat Clicker Rate
What it measures: Percentage of employees who click on simulations more than once in a 6-month window.
Why it matters: Identifies the persistently vulnerable population that needs targeted intervention. These employees represent the highest risk and should receive 1-on-1 coaching.
Target: Below 3% at 12 months.
5. Real Incident Count
What it measures: Number of actual security incidents caused by human error — successful phishing, credential compromise, data exposure, malware installation from user action.
Why it matters: This is the ultimate outcome metric. All other metrics are proxies; this is the real thing.
Target: Year-over-year downward trend. Set a specific reduction target based on your baseline.
6. Cost-Per-Incident
What it measures: Average cost to respond to and remediate a human-caused security incident, including SOC time, system restoration, legal, notification, and business disruption.
Why it matters: This is how you calculate ROI. If you can reduce this number or reduce the number of incidents, you have hard dollar savings.
Benchmark: Average phishing incident costs $14,900 (Ponemon). BEC incidents average $125,000. Ransomware from phishing averages $1.27 million.
7. Security Champion Engagement
What it measures: Percentage of departments with an active Security Champion and the number of peer interactions (questions answered, threats reported, trainings facilitated) per champion per month.
Why it matters: Security Champions extend the security team's reach. Active champions correlate with lower department-level click rates.
Target: 1 champion per department, minimum 3 peer interactions per month.
8. Culture Score
What it measures: Annual survey asking employees: "Do you feel personally responsible for the company's cybersecurity?" "Would you know what to do if you suspected a phishing email?" "Do you feel comfortable reporting a security mistake?"
Why it matters: Culture metrics predict long-term sustainability. A program with great click rates but poor culture scores will lose effectiveness when leadership attention shifts.
Target: 80% positive response rate on all three questions within 18 months.
Calculating ROI in Dollars
Here is the ROI formula that makes sense to executives:
Annual ROI = ((Incidents Prevented x Average Incident Cost) - Program Cost) / Program Cost x 100
Let us work through a real example for a 500-person company:
| Variable | Value | Source |
|---|---|---|
| Program cost (platform + time) | $24,000/year | KnowBe4 mid-tier quote |
| Baseline incidents before program | 8/year | Internal incident log |
| Incidents after 12 months of program | 3/year | Internal incident log |
| Incidents prevented | 5 | 8 - 3 |
| Average cost per incident | $47,000 | Ponemon + internal data |
| Cost avoided | $235,000 | 5 x $47,000 |
| ROI | 879% | ($235K - $24K) / $24K x 100 |
Even with conservative estimates — say only 2 incidents prevented at $50,000 each — the ROI is still 317%. Security awareness training is one of the highest-ROI investments in cybersecurity because incident costs are so high relative to training costs.
The Executive Dashboard
Executives do not want 20 metrics. They want a single page with four items:
- Risk trend arrow: Are we getting safer or not? A single trending line of phishing click rate over time. Up = bad, down = good.
- Dollar impact: "Our program prevented an estimated $235,000 in incident costs this year against a $24,000 investment."
- Industry benchmark: "Our click rate is 4.2%, compared to the industry average of 17.8%." Instant credibility.
- Action item: One specific recommendation: "Finance department click rate has plateaued at 12%. We recommend targeted BEC training for this group."
Present this quarterly. Keep it to one page. Never present more than 4 charts. The less busy the dashboard, the more likely executives will actually read it and continue funding the program.
Industry Benchmarks for Comparison
| Metric | Average | Good | Excellent |
|---|---|---|---|
| Phishing click rate | 17.8% | <10% | <5% |
| Report rate | 13% | 40% | >60% |
| Repeat clicker rate | 15% | <8% | <3% |
| Time-to-report | 45 min | <20 min | <10 min |
| Training completion | 72% | 90% | >95% |
Use these benchmarks carefully. A 5% click rate in healthcare (heavily targeted industry) is more impressive than a 5% click rate in a 20-person tech startup. Context matters. Compare against your own baseline first; use industry benchmarks as secondary reference points.
Reporting Cadence
Monthly (internal security team): Raw data review. Click rates, report rates, repeat clickers. Identify individuals needing coaching. Adjust simulation difficulty and topics.
Quarterly (leadership): One-page executive dashboard. Trend lines, dollar impact, benchmark comparison, one action item. This is the meeting that keeps your budget alive.
Semi-annually (program strategy): Full program review. What is working? What is stale? Which departments are improving and which are stuck? Adjust content strategy, introduce new gamification elements, update risk assessments.
Annually (board/compliance): Year-over-year comparison. Total incidents prevented, ROI calculation, compliance status, strategic plan for next year. This is the document that gets filed for auditors and presented to the board risk committee.
The key insight is this: stop measuring what people learn and start measuring what people do. A program with a 70% quiz pass rate and a 25% phishing click rate is failing. A program with no quizzes and a 4% click rate is succeeding. Choose your metrics accordingly.