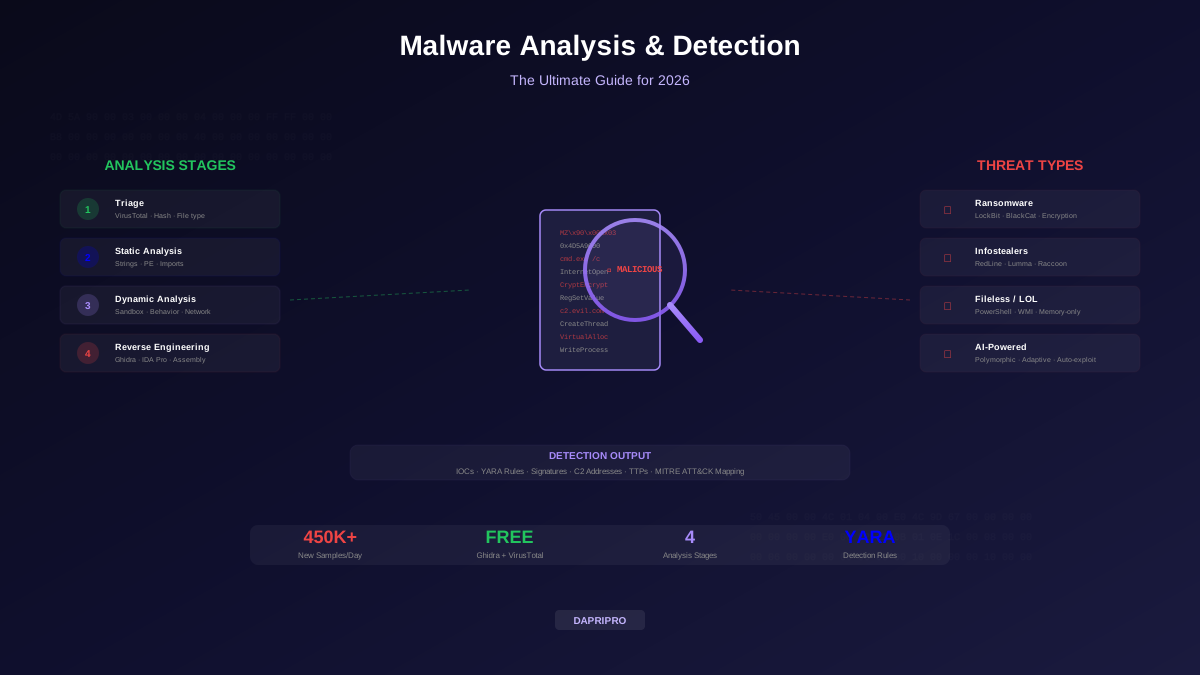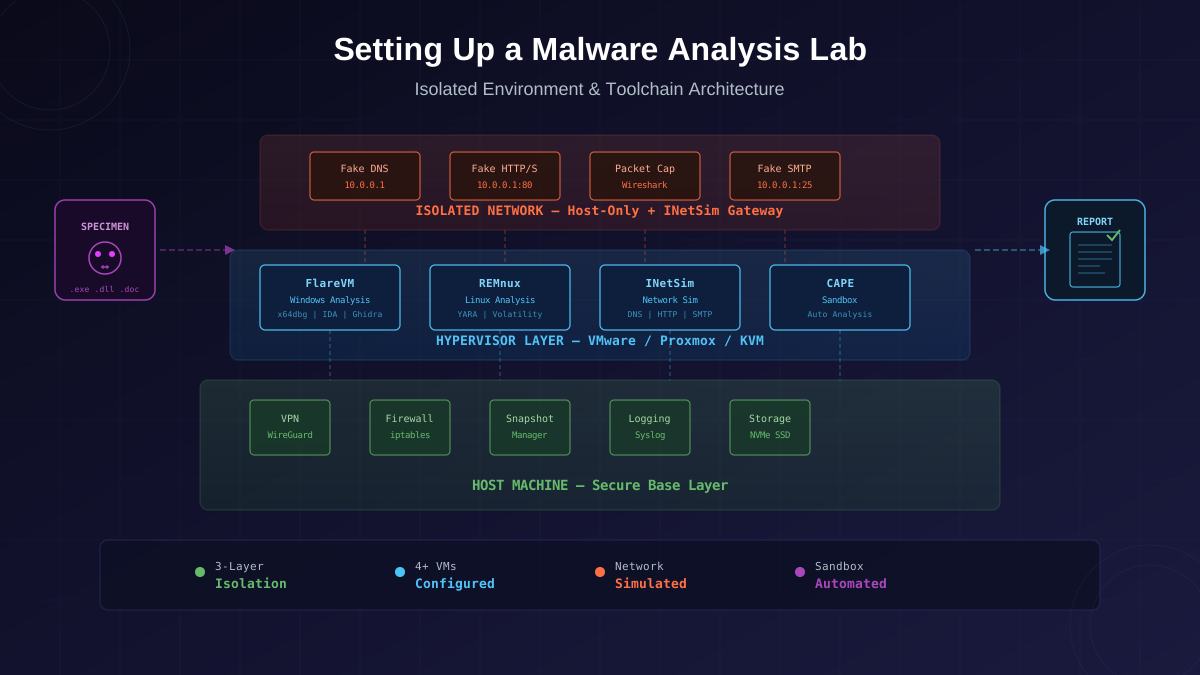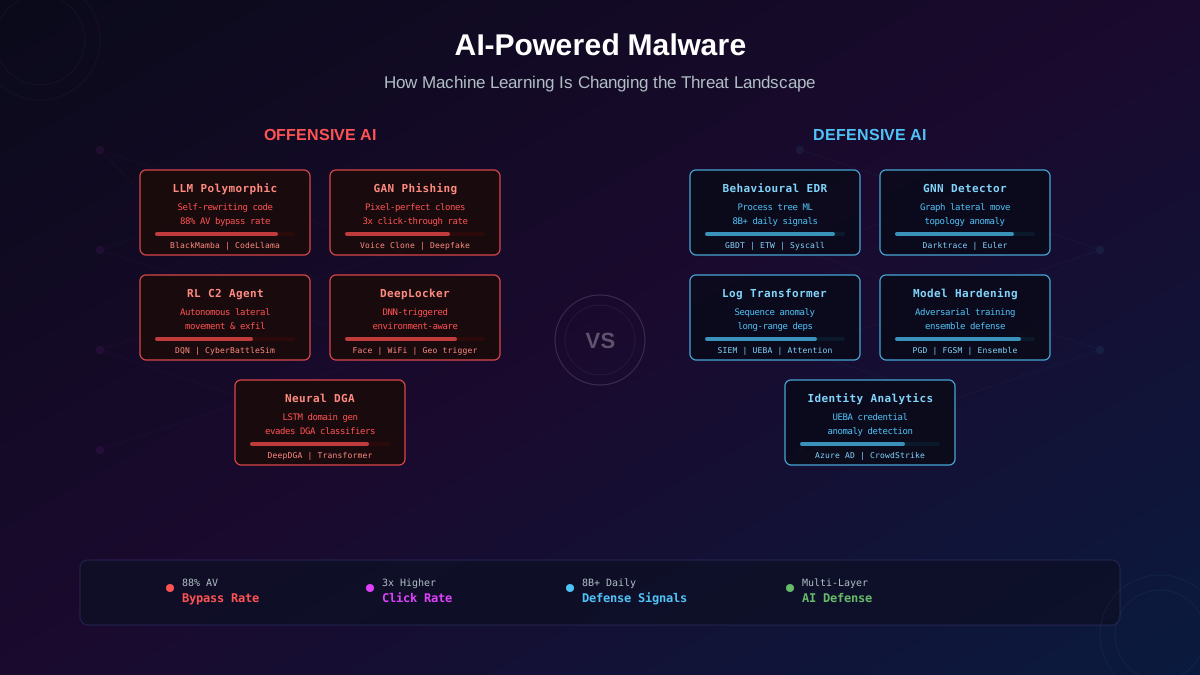

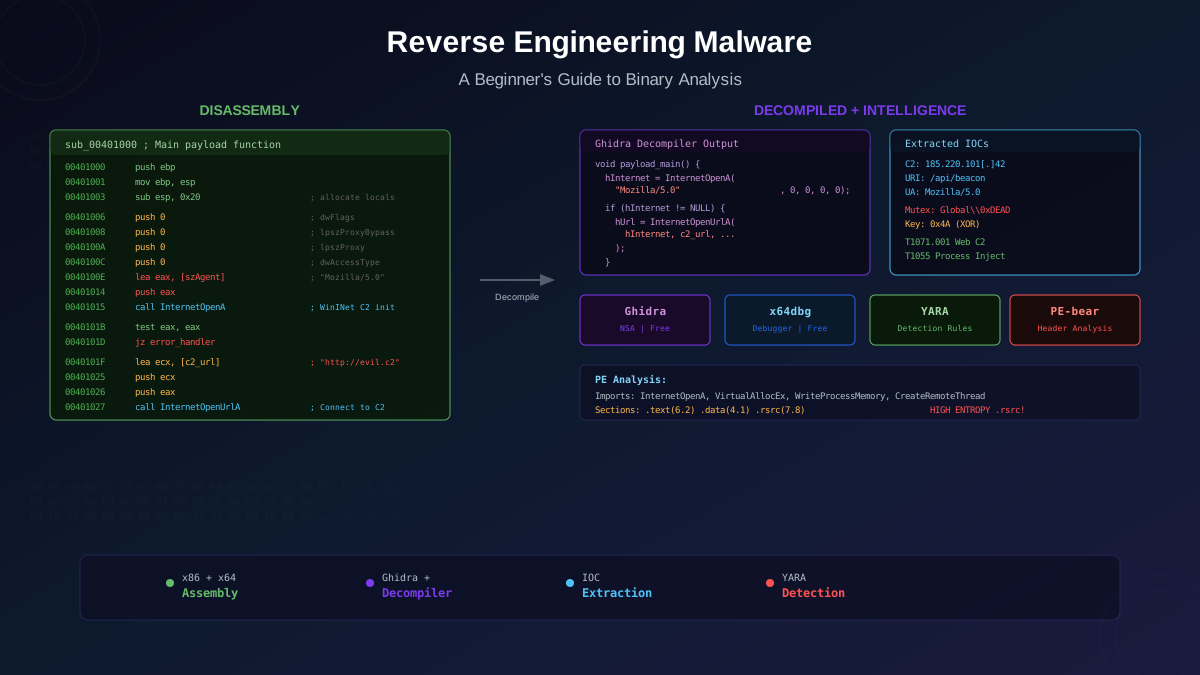
Reverse engineering malware is the process of taking a compiled binary — an EXE, DLL, or shellcode blob — and working backwards to understand its logic, capabilities, and intent. You do not have source code. You have machine code, and your job is to transform it into something a human can reason about: control flow graphs, decompiled pseudocode, extracted strings, and ultimately a complete behavioural description that feeds detection rules and incident response. This guide takes you from zero to your first analysed sample, covering the tools, the methodology, and the x86 fundamentals you need to start producing useful intelligence.
Why Reverse Engineering Matters for Defense
Automated sandboxes like CAPE and Any.Run tell you what malware does — it created this file, contacted this IP, injected into this process. Reverse engineering tells you how and why. It reveals the encryption algorithm protecting C2 traffic (which lets you decrypt intercepted packets), the mutex name the malware checks before executing (which becomes a vaccination mechanism), the specific Windows API evasion techniques used (which informs detection engineering), and the campaign infrastructure encoded in configuration blocks (which feeds threat intelligence).
For security teams, RE capabilities transform incident response from reactive containment to proactive threat hunting. When you can reverse an implant, you can write YARA rules that match the entire malware family, not just one sample. You can extract the full C2 infrastructure and block it preemptively. You can understand the attacker's capabilities and predict their next moves.
Essential Reverse Engineering Tools
Ghidra: Your Starting Disassembler
Ghidra is an open-source reverse engineering framework developed by the NSA and released publicly in 2019. It supports x86, x64, ARM, MIPS, PowerPC, and dozens of other architectures. Its killer feature is the built-in decompiler that transforms assembly into C-like pseudocode, making code comprehension dramatically faster for beginners.
To set up Ghidra: install JDK 17+, download the latest Ghidra release, create a new project, import your binary (File > Import File), let the auto-analysis run (it takes 30 seconds to several minutes depending on binary size), then double-click the binary in the project tree to open the CodeBrowser. The disassembly listing appears on the left, the decompiler output on the right. Navigate to functions of interest using the Symbol Tree on the far left or the Search > For Strings dialog to find interesting strings and the functions that reference them.
x64dbg: Your Starting Debugger
x64dbg is an open-source user-mode debugger for Windows. It replaces OllyDbg for modern 64-bit analysis. Key capabilities: set breakpoints on API calls (bp CreateFileW), step through code instruction by instruction (F7 for step-into, F8 for step-over), inspect register and stack state, modify memory and registers at runtime, and trace execution paths. Use x64dbg when static analysis alone cannot resolve dynamic behaviour — for example, when strings are decrypted at runtime, or when you need to dump an unpacked payload from memory.
Understanding the PE Format
Every Windows executable is a PE (Portable Executable) file. The PE header is your first and most efficient source of intelligence before you ever open a disassembler. Key header fields to examine:
Import Address Table (IAT)
The IAT lists every Windows API function the binary calls. This is the single most informative PE artefact. Group imports by category to infer capabilities:
- Networking:
WSAStartup,connect,send,recv,InternetOpenA,HttpSendRequestA— the binary communicates over the network, likely with C2 infrastructure. - File operations:
CreateFileA,WriteFile,ReadFile,DeleteFileA— reads, writes, or deletes files. Cross-reference with string analysis to find target paths. - Process manipulation:
OpenProcess,VirtualAllocEx,WriteProcessMemory,CreateRemoteThread— classic process injection. This sequence is a high-confidence malicious indicator. - Registry:
RegOpenKeyExA,RegSetValueExA— persistence or configuration storage in the Registry. - Cryptography:
CryptEncrypt,CryptDecrypt,BCryptEncrypt— encryption of data, communications, or files (ransomware indicator). - Anti-analysis:
IsDebuggerPresent,CheckRemoteDebuggerPresent,GetTickCount,NtQueryInformationProcess— the binary detects analysis environments.
Section Table
PE files are divided into sections (.text, .data, .rdata, .rsrc). Anomalies in section properties reveal packing and code injection:
- Executable sections with high entropy (>7.0): Indicates packed or encrypted code. Legitimate code typically has entropy between 5.0-6.5.
- Non-standard section names: Names like
.UPX0,.aspack, or random strings indicate known packers. - Writable + executable sections: The
.textsection should be readable and executable but not writable. A writable code section suggests self-modifying code or runtime unpacking. - Large .rsrc section: Resources containing embedded executables, scripts, or encrypted payloads. Use Resource Hacker to inspect embedded content.
Timestamps and Compilation Artefacts
The PE timestamp (IMAGE_FILE_HEADER.TimeDateStamp) records the compilation time. While trivially forged, many malware authors do not bother changing it. Cross-referencing timestamps across samples from the same campaign can establish timeline and attribution. The linker version, debug directory (PDB path), and Rich header provide additional compilation environment fingerprints.
x86 Assembly Essentials for Malware Analysis
You do not need to memorise the entire x86 instruction set. Focus on these categories that appear in virtually every malware sample:
Data Movement
MOV copies data between registers and memory. LEA (Load Effective Address) computes an address without accessing memory — frequently used for string pointer setup. PUSH and POP manipulate the stack, and you will see them constantly in function call setup.
Function Calls and Stack Frames
Every function begins with a prologue: push ebp; mov ebp, esp; sub esp, N (save the old base pointer, set up a new one, allocate N bytes of local variables). It ends with an epilogue: mov esp, ebp; pop ebp; ret (restore the stack and return). Recognising this pattern lets you identify function boundaries even when symbols are stripped.
Arguments are passed either on the stack (push arg3; push arg2; push arg1; call function — the cdecl/stdcall convention) or in registers (RCX, RDX, R8, R9 for the first four args — the x64 fastcall convention). Knowing which convention is in use tells you what the arguments are when you see a CALL instruction.
Comparison and Branching
CMP compares two values (subtracts without storing the result, setting CPU flags). TEST performs a bitwise AND, also setting flags. The subsequent conditional jump instruction acts on those flags: JE/JZ (jump if equal/zero), JNE/JNZ (jump if not equal), JA/JB (above/below for unsigned), JG/JL (greater/less for signed). These form the if/else, while, and for constructs in disassembly.
XOR: The Universal Swiss Army Knife
XOR reg, reg (same register) zeros the register — the most efficient way to set a register to zero. XOR with a key value is used for string and data decryption in malware. When you see a loop that reads a byte, XORs it with a constant, and writes it back, you have found an encryption/decryption routine. Extract the key and the ciphertext, and you can decrypt offline.
Your First Analysis: Step-by-Step Walkthrough
Here is the methodology for analysing an unknown PE sample, from receipt to actionable intelligence:
Step 1: Triage (5 minutes)
- Hash the sample (SHA-256) and check VirusTotal for existing detections. If 50+ engines detect it, you likely have a known family — read existing reports before spending time on RE.
- Run
fileor Detect It Easy to identify the file type, architecture (32-bit vs 64-bit), and packer (if any). - Run
stringsagainst the binary. Look for URLs, IP addresses, file paths, registry keys, mutex names, and error messages. FLOSS (FireEye Labs Obfuscated String Solver) automatically decodes obfuscated strings. - Open pestudio or PE-bear. Check the import table, section entropy, and compilation timestamp. Note anomalies.
Step 2: Static Analysis in Ghidra (30-60 minutes)
- Import the binary and run auto-analysis. Navigate to the entry point (usually
_startorWinMain). - Use the decompiler to read the entry function. Follow the call chain: the entry point typically calls initialisation functions, then the main payload logic.
- Search for cross-references (XREFs) to interesting APIs. Right-click any import in the Symbol Tree and select "Show References To" to find every location in the code that calls that API.
- Identify the C2 communication function: look for calls to networking APIs, trace backwards to find URL/IP construction, and extract the C2 addresses.
- Identify the persistence mechanism: follow calls to RegSetValueExA, CreateService, or ScheduledTask creation functions.
- Identify encryption routines: look for XOR loops, calls to CryptEncrypt, or implementations of known algorithms (AES S-box constants, RC4 key scheduling).
Step 3: Dynamic Validation (15-30 minutes)
- Take a clean VM snapshot. Load the sample in x64dbg.
- Set breakpoints on the API calls identified in static analysis. Run the sample.
- When breakpoints hit, inspect the arguments: the C2 URL being passed to InternetOpenUrlA, the registry key being written, the process being injected into.
- For encrypted strings: set a breakpoint after the decryption routine and dump the plaintext from memory.
- Capture network traffic with Wireshark (through INetSim) to see the actual C2 communication protocol.
Step 4: Intelligence Extraction
From a single analysed sample, you should extract: C2 IP addresses and domains, C2 communication protocol details (beaconing interval, data format, encryption), mutex names (can be used as detection/vaccination), file paths created or modified, registry keys used for persistence, encryption keys or algorithms, YARA-signable byte sequences (unique code patterns), and a MITRE ATT&CK technique mapping.
Handling Packed and Obfuscated Malware
Most malware in the wild is packed — compressed or encrypted with a runtime unpacker stub. Packed binaries show minimal imports (just LoadLibraryA and GetProcAddress to resolve APIs dynamically), high-entropy sections, and obfuscated strings. Before meaningful analysis, you must unpack the sample.
Manual Unpacking Methodology
- Identify the packer: Use Detect It Easy or PEiD. Common packers: UPX (trivially unpacked with
upx -d), ASPack, Themida, VMProtect, custom packers. - Find the Original Entry Point (OEP): In x64dbg, set a hardware breakpoint on the first byte of the .text section. Run the sample. When the unpacker writes the original code, the breakpoint triggers, and EIP points near the OEP.
- Dump from memory: Once the code is unpacked in memory, use Scylla (integrated into x64dbg) to dump the process and fix the Import Address Table. The result is a clean, unpacked PE that opens normally in Ghidra.
Common Anti-Analysis Techniques
Malware frequently checks for analysis environments before executing its payload:
- Debugger detection:
IsDebuggerPresent(), timing checks (GetTickCount/RDTSCdifferential), and PEB field inspection. Bypass: patch the PEBBeingDebuggedfield, use ScyllaHide plugin in x64dbg. - VM detection: Check for VM-specific registry keys (VBox/VMware), MAC address OUI prefixes, CPUID hypervisor bit, and known sandbox filenames. Bypass: harden your analysis VM to appear as a physical machine.
- Sandbox evasion: Sleep for extended periods (bypass: hook
Sleep()to return immediately), check for user interaction (mouse movement, click count), require specific execution conditions (date/time, domain membership).
Writing YARA Rules From Your Analysis
The ultimate output of reverse engineering is actionable detection. YARA rules match byte patterns, strings, and structural conditions in files or memory. A well-crafted YARA rule from your analysis can detect the entire malware family, not just the sample you reversed.
Effective YARA rule components from RE analysis:
- Unique strings: Mutex names, PDB paths, C2 URL patterns, custom error messages — strings that appear in this malware family but not in legitimate software.
- Opcode sequences: The byte pattern of a distinctive decryption routine, an unusual API call sequence, or a custom algorithm implementation. These survive recompilation better than strings.
- PE structural conditions: Specific import combinations (e.g.,
VirtualAllocEx AND WriteProcessMemory AND CreateRemoteThread), unusual section names, or timestamp ranges. - Configuration extraction patterns: Byte patterns surrounding embedded configuration data (C2 addresses, encryption keys) that remain consistent across samples even when the configuration values change.
Test your YARA rule against the original sample (true positive), clean software (false positive check), and any related samples you can find on VirusTotal or MalwareBazaar. A rule that fires on legitimate Microsoft binaries is worse than no rule at all.
Building Your RE Skills
Reverse engineering is a craft that improves with practice. Resources to build your skills:
- Practice platforms: Malware Traffic Analysis (malware-traffic-analysis.net), MalwareBazaar (bazaar.abuse.ch), and crackmes.one for progressively challenging binaries.
- Structured learning: "Practical Malware Analysis" by Sikorski and Honig remains the gold standard textbook. OpenSecurityTraining2 offers free university-level RE courses. The SANS FOR610 course provides hands-on malware analysis training.
- Community: Follow RE practitioners on Twitter/X, read writeups on the OALabs blog, watch Binary Ninja's RE livestreams, and join the Ghidra community Discord for plugin recommendations and analysis tips.
- Certifications: GIAC Reverse Engineering Malware (GREM) validates professional RE skills. The eLearnSecurity Certified Malware Analysis Professional (eCMAP) provides a practical exam format.
Start with simple samples — keyloggers, basic RATs, commodity stealers — before tackling nation-state implants or heavily virtualised protectors. Each analysis builds pattern recognition that makes the next one faster. After 20-30 samples, you will recognise common code patterns, packer signatures, and C2 frameworks on sight.